The Fed Is Doing Exactly What They Did In 1937. The Final Economic Trap Is Set
リアクション
2026年07月24日
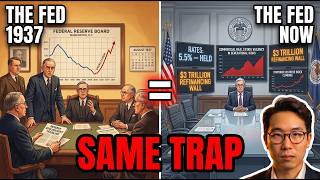
In August 1937, Federal Reserve governor Marriner Eccles watched an unemployment chart move in the wrong direction. Four years of recovery from the Great Depression — unemployment down from 25% to 14%, industrial production near pre-Depression levels — had convinced the Fed the emergency was over. In 1936 and early 1937, it doubled reserve requirements. The Treasury sterilized gold inflows. The White House moved toward fiscal austerity. Three simultaneous tightening decisions. Each individually reasonable. Collectively catastrophic. By the end of 1937, unemployment was back at 19%. Industrial production had fallen 33%. The Dow had lost 49%. Four years of recovery erased in eight months. The Roosevelt Recession — a recession caused not by external shock but by policy error — became the defining case study in what happens when tightening precedes structural healing.
The Federal Reserve raised rates from near zero to 5.5% in the fastest tightening cycle in forty years. Inflation fell from 9.1% to approximately 3%. The recovery appeared complete. But commercial real estate vacancy rates sit at generational highs. The $3 trillion corporate refinancing wall is working through the system one maturity at a time. Regional banks hold concentrated commercial real estate exposure underwritten at rates that no longer exist. Federal spending restraint is producing real cuts alongside monetary restriction. Three simultaneous pressures in 2025. Each individually defensible. The 1937 mechanism identifies exactly what happens when they arrive together against a structure that looks healed but isn't. The lag between policy decision and visible outcome in 1937 was eighteen months. The 2025 tightening decisions were made in 2023 and 2024.
What You'll Learn:
▸ What the Roosevelt Recession of 1937 actually was — and why a recession inside the Great Depression was caused by policy error rather than external shock
▸ How three simultaneous tightening decisions — Fed reserve requirements, Treasury gold sterilization, White House fiscal austerity — each individually defensible, produced a collectively catastrophic outcome
▸ Why the structural recovery of 1936 was real in appearance but fragile in structure — and why the distinction is the entire lesson
▸ How the Fed's 2025 position — rates held at 5.5%, fiscal restraint, corporate refinancing pressure — replicates the 1937 additive tightening structure
▸ Why the eighteen-month lag between the 1937 policy decisions and their visible economic consequences maps directly onto the 2025 timing
▸ What commercial real estate stress, the $3 trillion refinancing wall, and regional bank exposure have in common with the 1937 structural fragility
▸ Why the reverse gear available to correct a 2025 policy error is smaller and more expensive than the reverse gear the Fed used successfully in 1938
The Timeline:
1929 — Great Depression begins; unemployment eventually reaches 25%
1933 — Roosevelt's New Deal begins; recovery starts
1936 — Unemployment at 14%; nominal recovery near pre-Depression levels; Fed judges emergency over
August 1936 — Fed doubles reserve requirements for first time
March 1937 — Fed doubles reserve requirements second time; Treasury begins gold sterilization
1937 — White House moves toward fiscal austerity; three simultaneous tightening decisions in place
August 1937 — Industrial production begins collapsing; Eccles watches unemployment chart reverse
End of 1937 — Unemployment back at 19%; industrial production down 33%; Dow down 49%
1938 — Fed reverses course; recovery resumes; lesson learned too late for those who absorbed the cost
March 2022 — Fed begins fastest tightening cycle in forty years
July 2023 — Fed funds rate reaches 5.5%; held at this level
2023-2024 — Corporate refinancing wall builds; commercial real estate stress accumulates; federal efficiency review begins
2025 — Three simultaneous pressures active; eighteen-month lag from 2023-2024 decisions now due
Eccles watched the chart move in August 1937. The 2025 chart has not moved yet. The mechanism that moved it in 1937 is running on the same timeline.
Subscribe to see the structure beneath the headlines before it becomes consensus.
The Federal Reserve raised rates from near zero to 5.5% in the fastest tightening cycle in forty years. Inflation fell from 9.1% to approximately 3%. The recovery appeared complete. But commercial real estate vacancy rates sit at generational highs. The $3 trillion corporate refinancing wall is working through the system one maturity at a time. Regional banks hold concentrated commercial real estate exposure underwritten at rates that no longer exist. Federal spending restraint is producing real cuts alongside monetary restriction. Three simultaneous pressures in 2025. Each individually defensible. The 1937 mechanism identifies exactly what happens when they arrive together against a structure that looks healed but isn't. The lag between policy decision and visible outcome in 1937 was eighteen months. The 2025 tightening decisions were made in 2023 and 2024.
What You'll Learn:
▸ What the Roosevelt Recession of 1937 actually was — and why a recession inside the Great Depression was caused by policy error rather than external shock
▸ How three simultaneous tightening decisions — Fed reserve requirements, Treasury gold sterilization, White House fiscal austerity — each individually defensible, produced a collectively catastrophic outcome
▸ Why the structural recovery of 1936 was real in appearance but fragile in structure — and why the distinction is the entire lesson
▸ How the Fed's 2025 position — rates held at 5.5%, fiscal restraint, corporate refinancing pressure — replicates the 1937 additive tightening structure
▸ Why the eighteen-month lag between the 1937 policy decisions and their visible economic consequences maps directly onto the 2025 timing
▸ What commercial real estate stress, the $3 trillion refinancing wall, and regional bank exposure have in common with the 1937 structural fragility
▸ Why the reverse gear available to correct a 2025 policy error is smaller and more expensive than the reverse gear the Fed used successfully in 1938
The Timeline:
1929 — Great Depression begins; unemployment eventually reaches 25%
1933 — Roosevelt's New Deal begins; recovery starts
1936 — Unemployment at 14%; nominal recovery near pre-Depression levels; Fed judges emergency over
August 1936 — Fed doubles reserve requirements for first time
March 1937 — Fed doubles reserve requirements second time; Treasury begins gold sterilization
1937 — White House moves toward fiscal austerity; three simultaneous tightening decisions in place
August 1937 — Industrial production begins collapsing; Eccles watches unemployment chart reverse
End of 1937 — Unemployment back at 19%; industrial production down 33%; Dow down 49%
1938 — Fed reverses course; recovery resumes; lesson learned too late for those who absorbed the cost
March 2022 — Fed begins fastest tightening cycle in forty years
July 2023 — Fed funds rate reaches 5.5%; held at this level
2023-2024 — Corporate refinancing wall builds; commercial real estate stress accumulates; federal efficiency review begins
2025 — Three simultaneous pressures active; eighteen-month lag from 2023-2024 decisions now due
Eccles watched the chart move in August 1937. The 2025 chart has not moved yet. The mechanism that moved it in 1937 is running on the same timeline.
Subscribe to see the structure beneath the headlines before it becomes consensus.