Why rents keep exploding as incomes go backwards
リアクション
2026年09月10日
👉 Want to buy BEFORE the data shifts, not after? Book a FREE strategy call with Curtis here: https://rebrand.ly/chatwithflintinvest
Australia is not in recession. But on the measure that actually decides what people can borrow, what they can buy and how they live, the 2020s are the worst stretch for living standards since the 1950s.
12 years ago Dr Martin Parkinson, then Secretary of the Treasury, stood up and said this would happen if we did nothing. He modelled a decade where real income per person landed near $69,000 instead of roughly $82,000, about $13,000 a year worse off. That was the do-nothing scenario. It is now the result.
In this episode I work through how we got here, from labour productivity to migration to housing completions, and then bring it back to the thing most investors care about: what structurally weaker income growth does to credit, and what credit does to house prices.
📍 Why labour productivity has gone from above 2% through the 1990s and 2000s to roughly 0% today, and why Treasury's own forecasts do not get us back above 1% inside 5 years
📍 How GDP kept growing on population rather than output per person, and what changes now migration falls from over 500,000 in 2023 to a forecast 260,000
📍 Why housing completions have sat at the same level as 10 to 15 years ago while the population surged, and what that did to rents
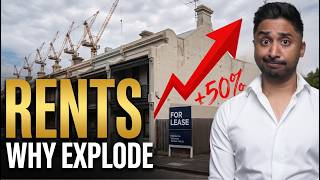
📍 How minimum wage rises chasing inflation left the same households paying around 50% more rent
📍 The number that gets me: 165,000 non-frontline public servants in 2020, 220,000 now, a 30% rise costing roughly $6.3 billion a year
📍 Why real income growth sits underneath every servicing calculator, and why 70 years of house price growth was really a credit story
📍 Why I think capital growth rates are structurally lower from here than the long-run 7% average, and why suburb selection matters far more than it used to
📍 Where I think the next wave of productivity and growth concentrates: Western Melbourne, the Hunter and Western Sydney
If you want the macro read before it shows up in prices, subscribe.
#AustralianProperty #AustralianEconomy #Productivity #CostOfLiving #PropertyInvesting
Chapters
00:00 Australia's lost decade
00:46 The Treasury warning from 12 years ago
02:46 Labour productivity is sitting at 0%
03:35 Why real income growth drives house prices
04:12 GDP is growing on population, not output
05:43 More people, no extra homes
06:57 Who actually pays for poor policy
08:02 Migration is about to halve
08:32 The economy has stopped growing
09:12 165,000 to 220,000 public servants
10:27 Taxing the businesses that lift productivity
11:35 Bringing it back to housing
13:06 Lower capital growth rates ahead
14:15 Where the growth concentrates next
14:49 How we work with investors
This video is provided by Confidence Finance Pty Ltd (ACL 488313) & Flint Trademark Pty Ltd. This is general information only and not personal advice. Please seek credit advice from us directly and independent tax, legal or financial advice where appropriate.
Australia is not in recession. But on the measure that actually decides what people can borrow, what they can buy and how they live, the 2020s are the worst stretch for living standards since the 1950s.
12 years ago Dr Martin Parkinson, then Secretary of the Treasury, stood up and said this would happen if we did nothing. He modelled a decade where real income per person landed near $69,000 instead of roughly $82,000, about $13,000 a year worse off. That was the do-nothing scenario. It is now the result.
In this episode I work through how we got here, from labour productivity to migration to housing completions, and then bring it back to the thing most investors care about: what structurally weaker income growth does to credit, and what credit does to house prices.
📍 Why labour productivity has gone from above 2% through the 1990s and 2000s to roughly 0% today, and why Treasury's own forecasts do not get us back above 1% inside 5 years
📍 How GDP kept growing on population rather than output per person, and what changes now migration falls from over 500,000 in 2023 to a forecast 260,000
📍 Why housing completions have sat at the same level as 10 to 15 years ago while the population surged, and what that did to rents
📍 How minimum wage rises chasing inflation left the same households paying around 50% more rent
📍 The number that gets me: 165,000 non-frontline public servants in 2020, 220,000 now, a 30% rise costing roughly $6.3 billion a year
📍 Why real income growth sits underneath every servicing calculator, and why 70 years of house price growth was really a credit story
📍 Why I think capital growth rates are structurally lower from here than the long-run 7% average, and why suburb selection matters far more than it used to
📍 Where I think the next wave of productivity and growth concentrates: Western Melbourne, the Hunter and Western Sydney
If you want the macro read before it shows up in prices, subscribe.
#AustralianProperty #AustralianEconomy #Productivity #CostOfLiving #PropertyInvesting
Chapters
00:00 Australia's lost decade
00:46 The Treasury warning from 12 years ago
02:46 Labour productivity is sitting at 0%
03:35 Why real income growth drives house prices
04:12 GDP is growing on population, not output
05:43 More people, no extra homes
06:57 Who actually pays for poor policy
08:02 Migration is about to halve
08:32 The economy has stopped growing
09:12 165,000 to 220,000 public servants
10:27 Taxing the businesses that lift productivity
11:35 Bringing it back to housing
13:06 Lower capital growth rates ahead
14:15 Where the growth concentrates next
14:49 How we work with investors
This video is provided by Confidence Finance Pty Ltd (ACL 488313) & Flint Trademark Pty Ltd. This is general information only and not personal advice. Please seek credit advice from us directly and independent tax, legal or financial advice where appropriate.